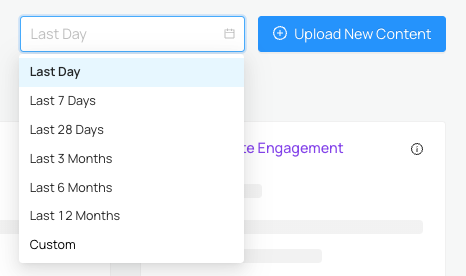
On the top right hand corner of your Dashboard, click on the date field on the top right corner of your dashboard and specify whatever time frame you'd like
If you'd like to see a specific timeframe, click "Custom" at the bottom of the dropdown
<aside> 💡 This article will provide an overview of Dashboard in the Gander App
</aside>
https://www.loom.com/share/3f5e55c1ec11495c9f8ef5b56cbea66f?sid=6506e16f-17d1-40db-81b4-5583641a24fa
On the top right hand corner of your Dashboard, click on the date field on the top right corner of your dashboard and specify whatever time frame you'd like
If you'd like to see a specific timeframe, click "Custom" at the bottom of the dropdown
The total sales driven by customers who engaged (played, paused etc) with your Gander videos.
<aside> 💡 Please note: We use multi-touch attribution to track Gander influenced sales. This means we look at all of the touch points your customers engage with leading up to a purchase, which gives us a fuller picture of what actually influenced them to purchase. This is considered to be one of the most accurate ways to track attributions in the industry. Our attribution window is 28 days.
</aside>
The average dollar amount spent each time a customer places an order after seeing a Gander video
The percentage of customers that placed an order after seeing a Gander video